Industrial Digital Twin · IoT · AI
We monitor, model, and transform your data into actionable insights. One platform connects every sensor, automates compliance reporting, and turns telemetry into board-ready ESG narratives.











Our Solutions
From stack emissions to energy use, we help industrial sites cut waste, run more efficiently and meet every environmental requirement, including Indonesia's KLH regulations.
See it in action
A live Digital Twin for an industrial hub. Real-time air and water quality, plus energy and water consumption: one console for the industrial estate, drill-down for each plant.

Indonesian Air Quality Index. Reading is within safe range (Good: 0-50).
Remaining environmental carrying capacity. Headroom for ~25-30 new heavy-industry tenants.
Demo data for illustration. Company names and readings are fictional.
How it works
We take care of everything from checking your site to delivering the final report. Don't need every solution? Pick the ones your site needs.
We inspect your stacks, outfalls and existing sensors, and verify which data you can already trust.
A small on-site device links all your sensors and instruments, and alerts you if one stops working.
MUSA Integrator 03 · UnifyScattered readings from every sensor and site, combined in one system. Cloud or on-premise.
MUSA Data Management 04 · MonitorSee all emissions, wastewater, and energy usage live, spot problems, and plan ahead.
MUSA View 05 · AlertChat or email with MUSA Assistant for answers and alerts, with sources shown so you can verify them.
MUSA AssistantKLH, PROPER and GRI-aligned reports, audit-ready and generated whenever you need them.
Not sure where to start? Talk to our expert
WhatsApp usBenefits for each industries
From single-site factories to full industrial estates. Pick your industry to see what suites your operational needs.
In the field
From consultation to the actual site, this is what MUSA deployment looks like.
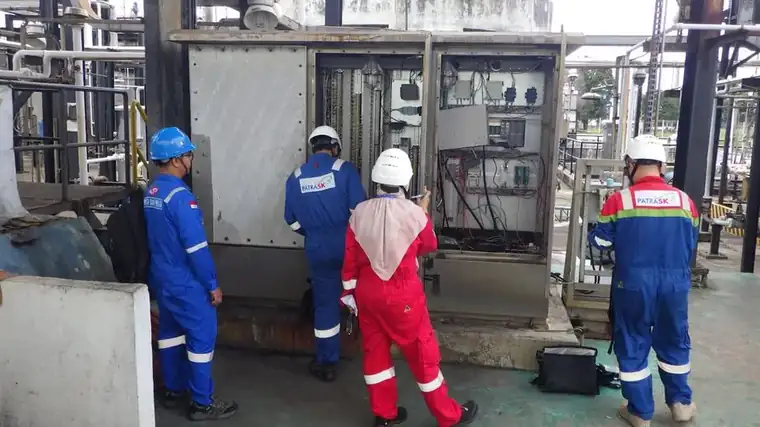
Enabling real-time monitoring of 4 water quality parameters & provides pollution load insights
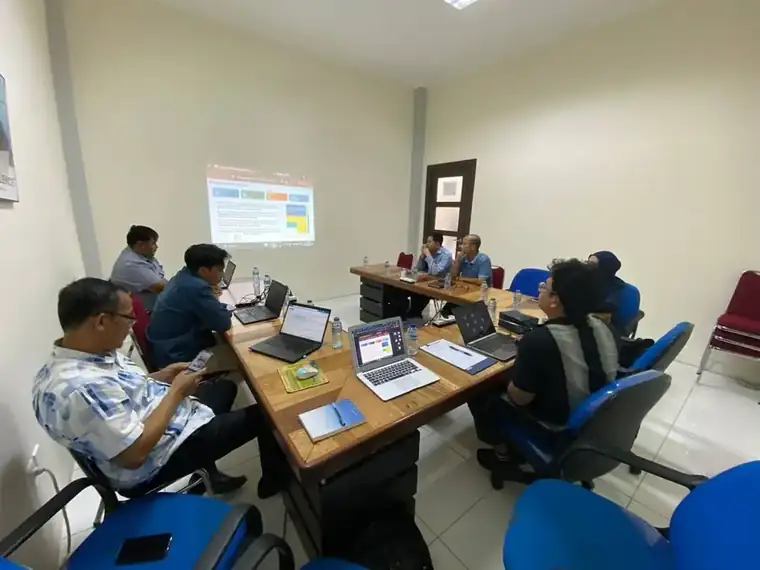
Mapping pollutant distribution across hundreds of smoke stacks & identifying air quality headroom
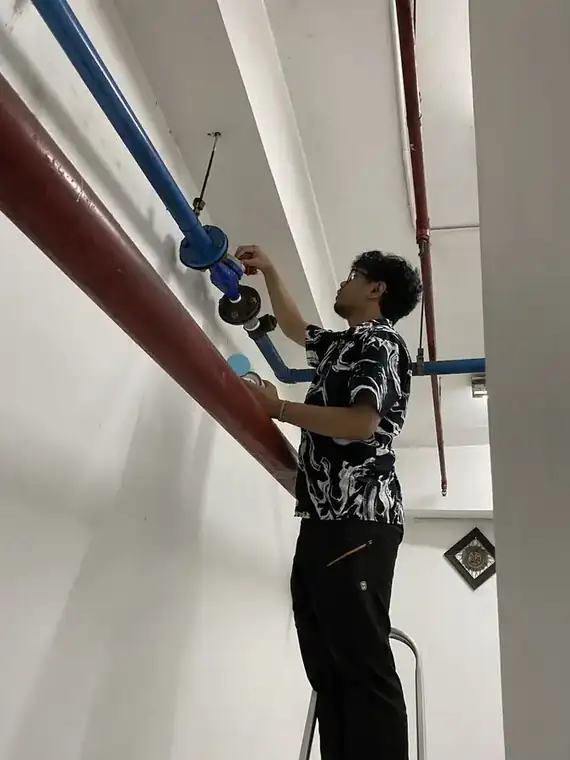
Implementing water tracking via MUSA Green OCR meters for Isuzu dealerships nationwide
Client stories
“We really appreciate MUSA Green, the SPARING system operates well so far. The team's response is also fast whenever we encounter any issues.”
FAQ
Most systems are live in under a week after the site check and data verification.
It depends on the parameters, sensors and hosting you need. Book a meeting and we'll scope a fixed quote.
MUSA does. We're hardware-agnostic, so we can connect the sensors you already own and install the ones you don't.
Yes. Estates that can't send data outside the gate get an on-premise warehouse. Everyone else runs on managed cloud with a 99.9% SLA.